Home network dashboard
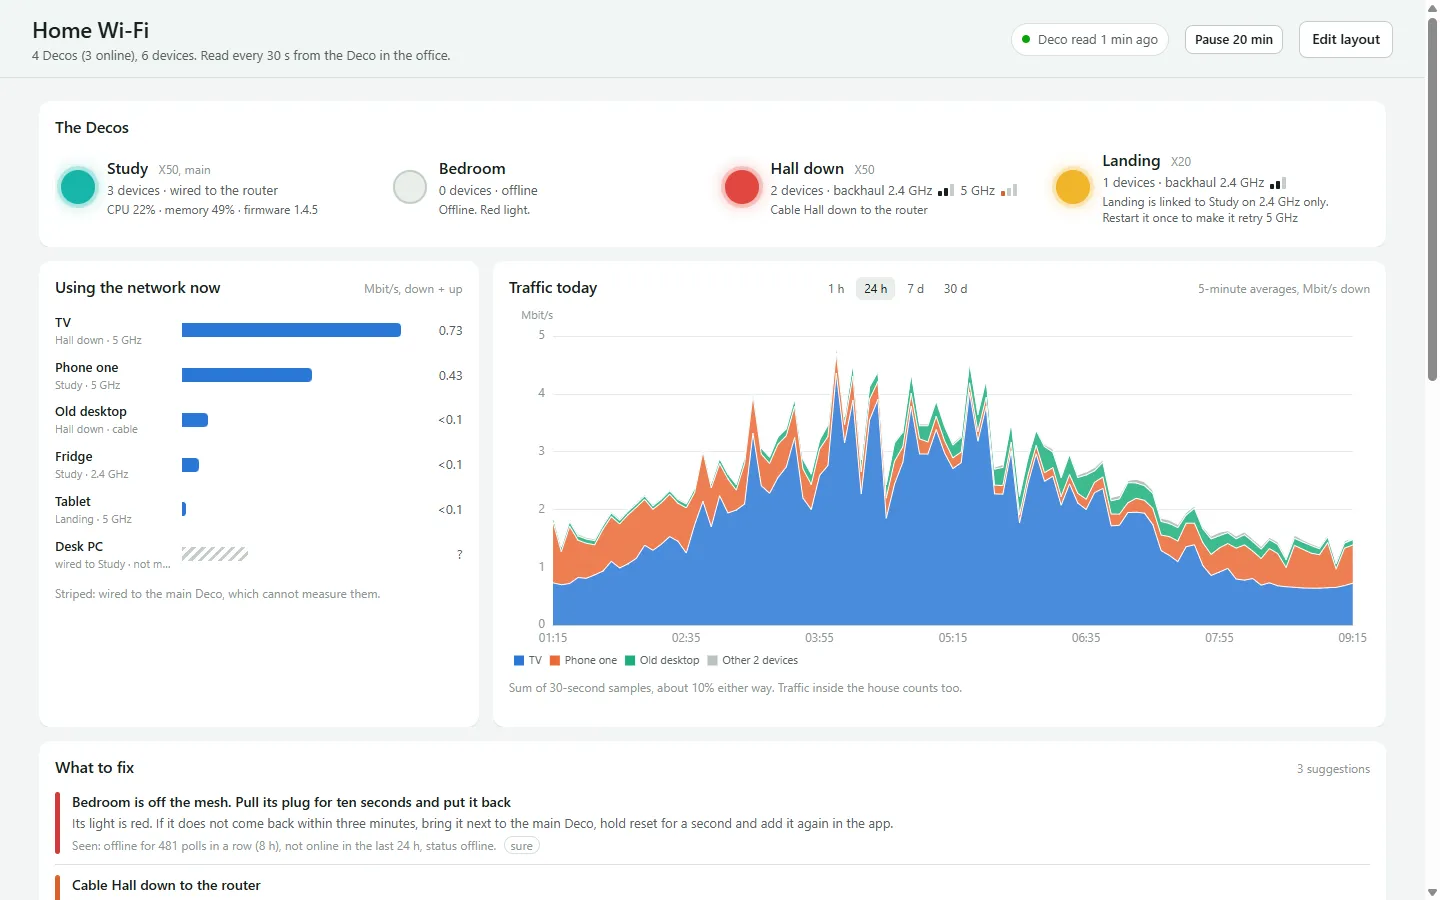
A dashboard for a home Wi-Fi mesh: where each access point is, how healthy it is, what is connected to it and what uses the most internet.
- Role
- Sole developer
- Year
- 2026
- Outcome
- The weak spots in the house Wi-Fi became visible: which access point is struggling, which devices sit on it, and whether a change actually helped.
- Built with
- Vue 3, TypeScript, Vite, gridstack, ECharts, reka-ui, Node 22, SQLite (node:sqlite), Vitest, Docker
Why I built it
A mesh Wi-Fi system with four access points had patchy signal and warning lights, and its own app gave no reason why. A packet sniffer on one computer cannot see the rest of the house.
What it does
The access points
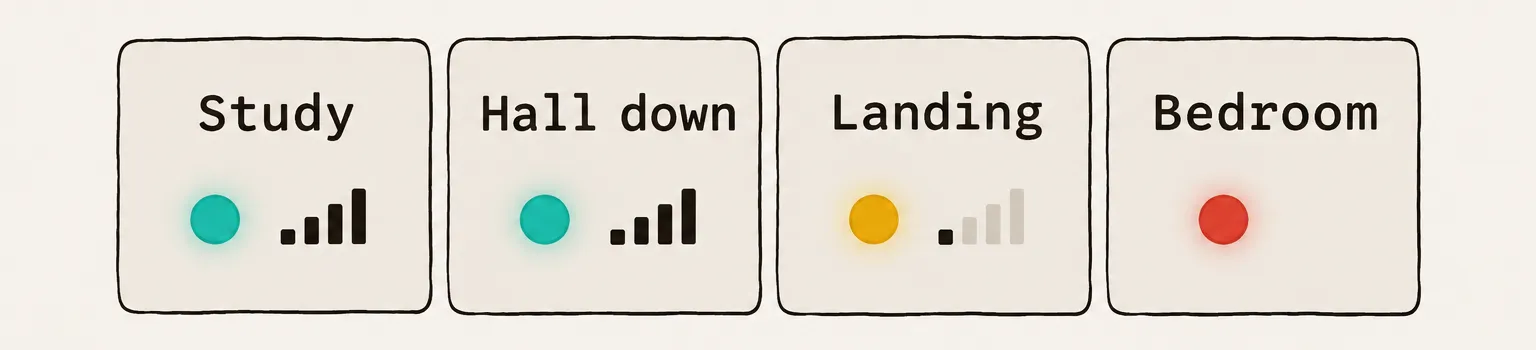
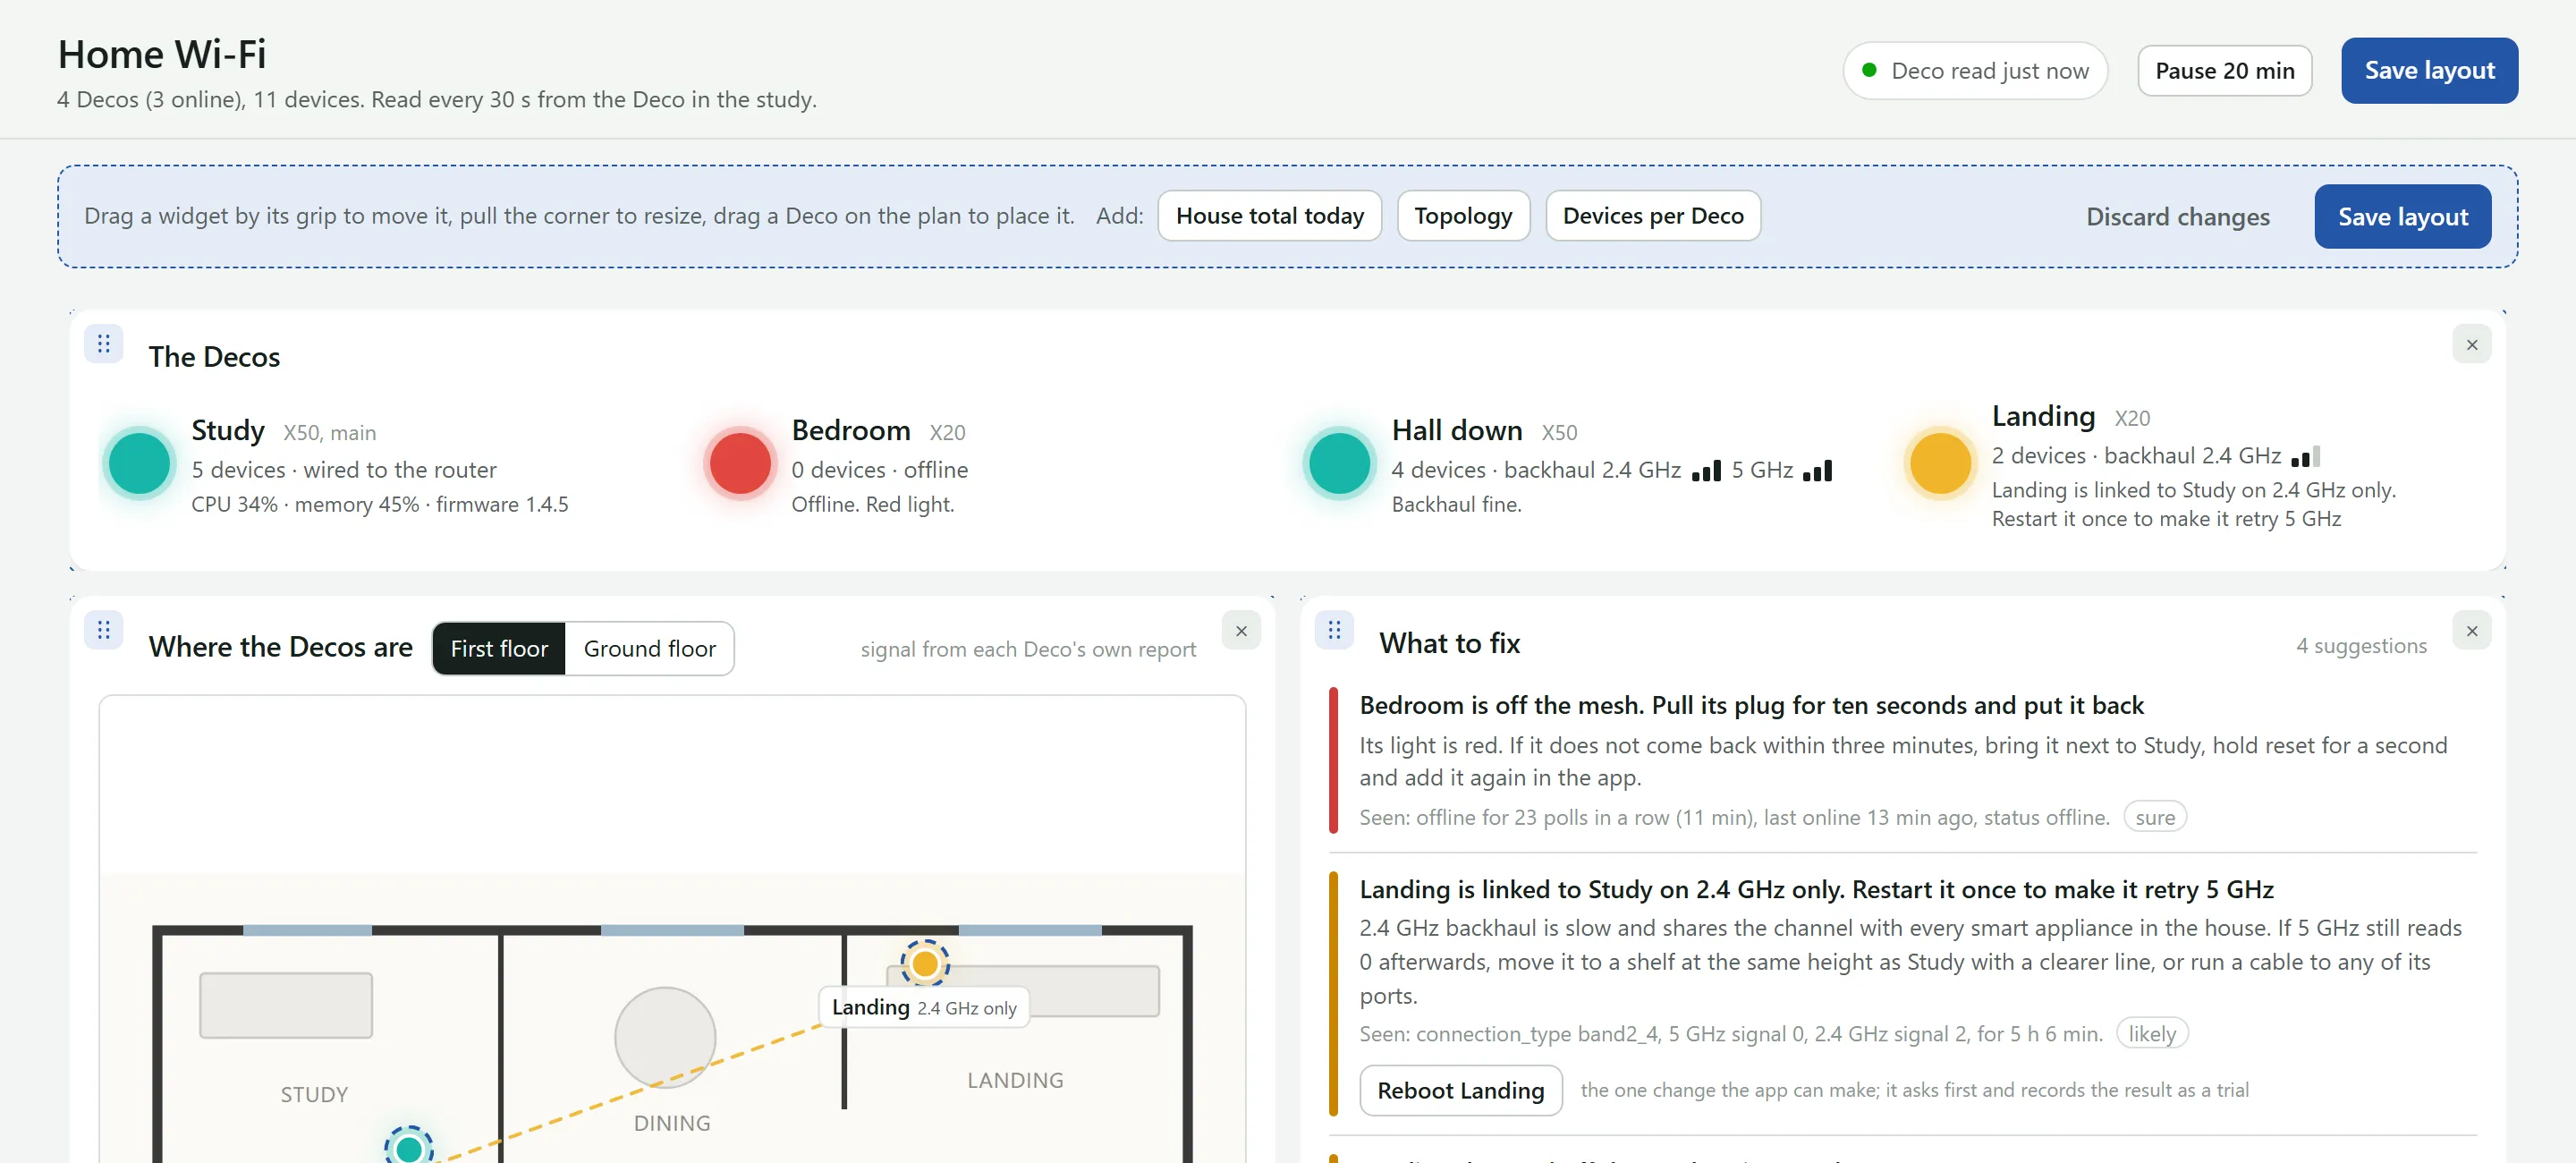
One tile per access point: model, role, whether it is online, the bands of its link back to the main unit, signal per band and the number of clients, with a light that is fine, limping or red. The same light is used on the tiles, the map and the topology, so they always agree.
The map
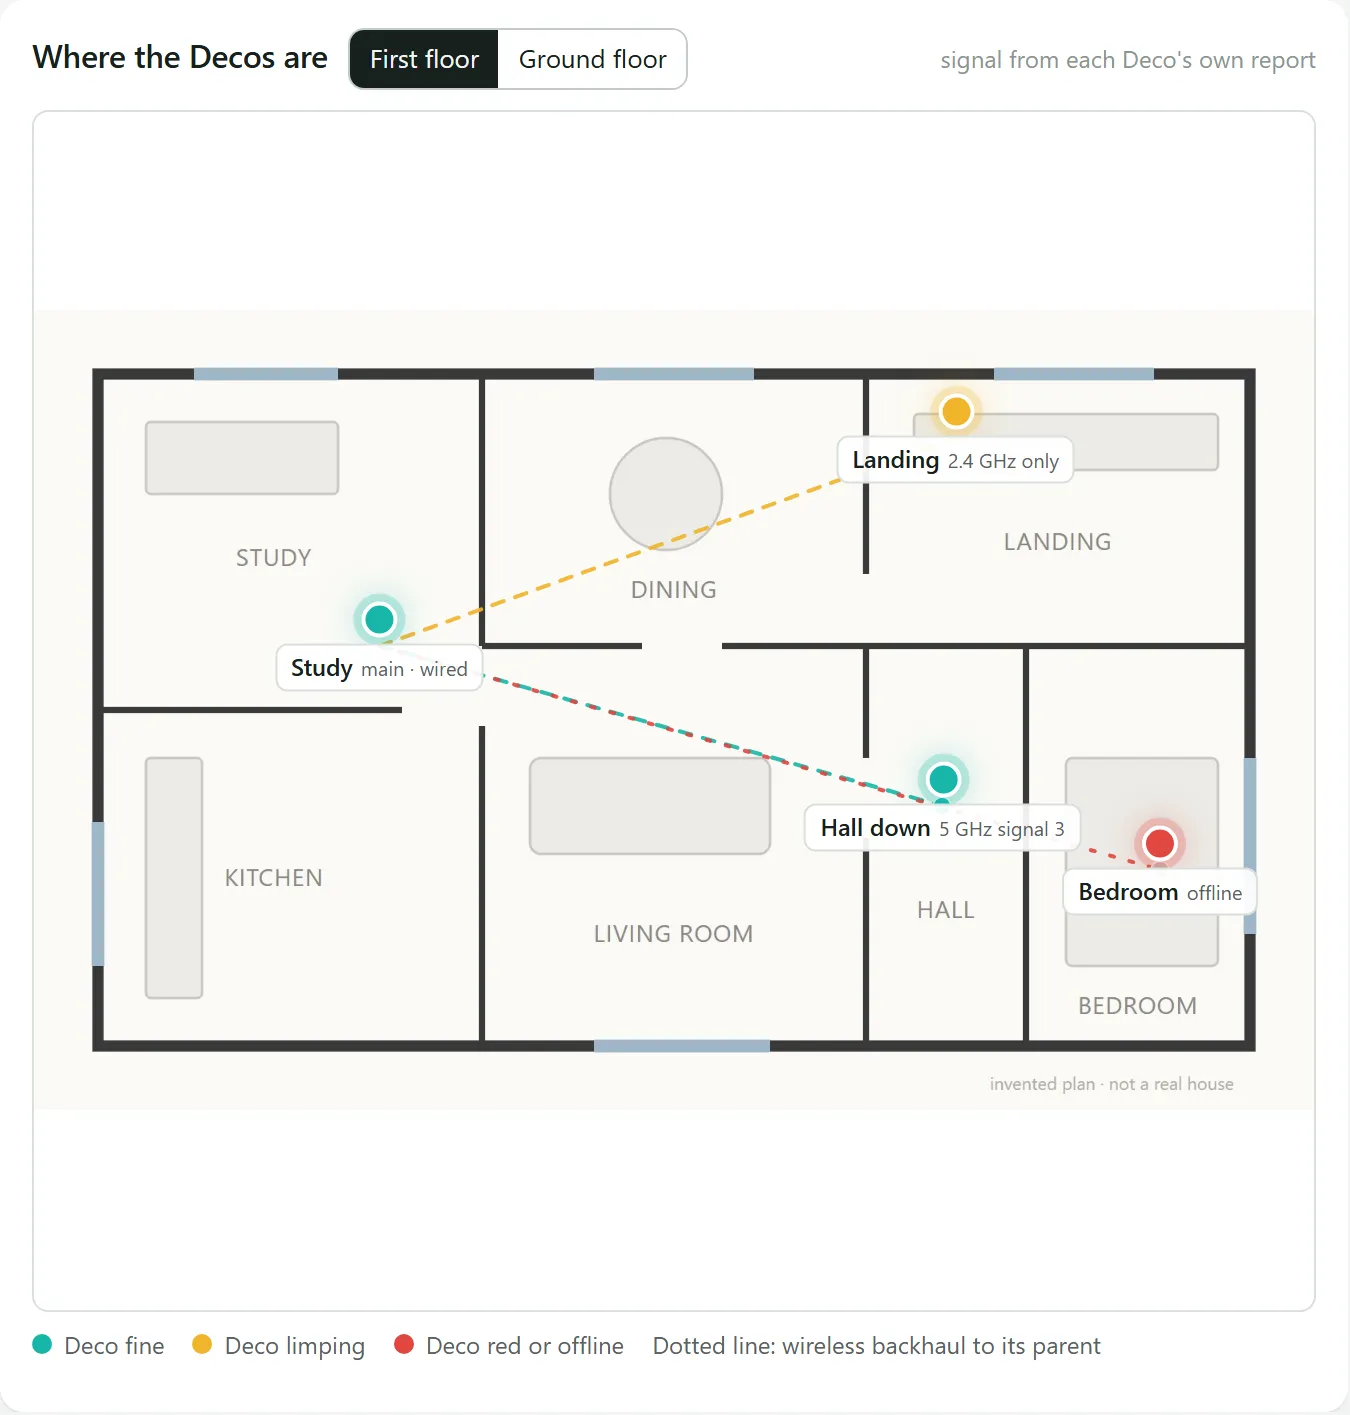
Each access point on the floor plan, one image per floor, with the links between them drawn in the colour of their light. Tap one to see its clients; in edit mode, drag it to where it really is. Dots mark spots tried before, coloured by how that went.
What to fix
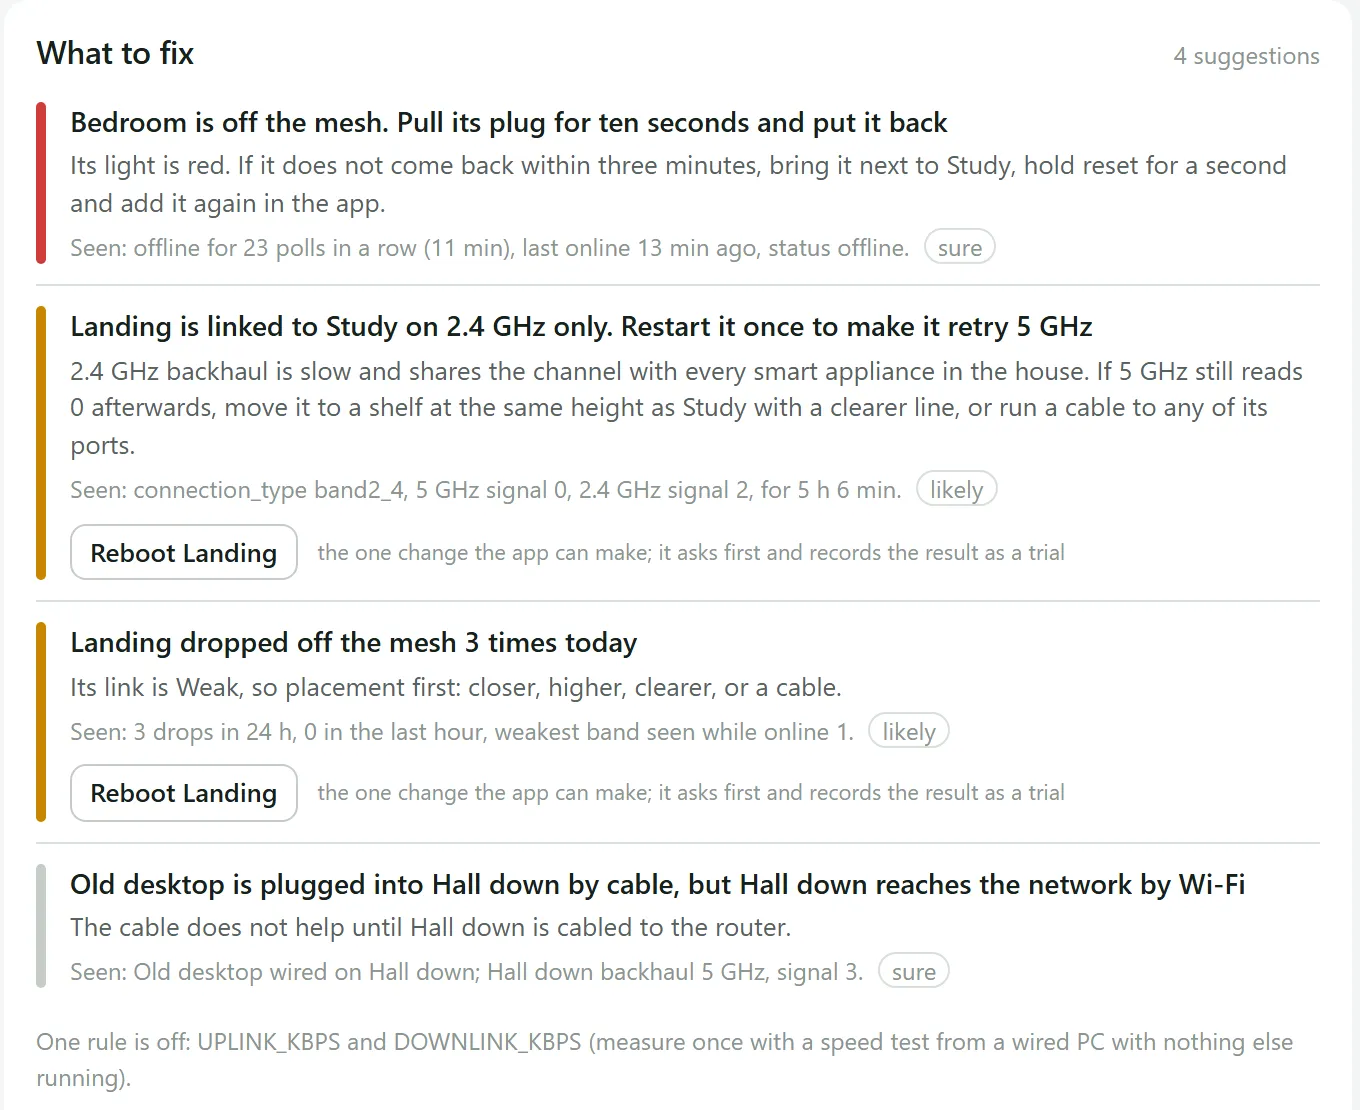
A rules engine reads the latest poll and the last 24 hours and writes cards in plain English: an action, the reason, a "Seen:" line with the real numbers, a severity and a confidence. About a dozen rules: a satellite offline, a weak or 2.4 GHz-only link, a device that should be cabled, an upload hog, a crowded 2.4 GHz band, a unit that keeps dropping off. Rules that need data the system does not have are shown as inactive rather than guessed.
Trials
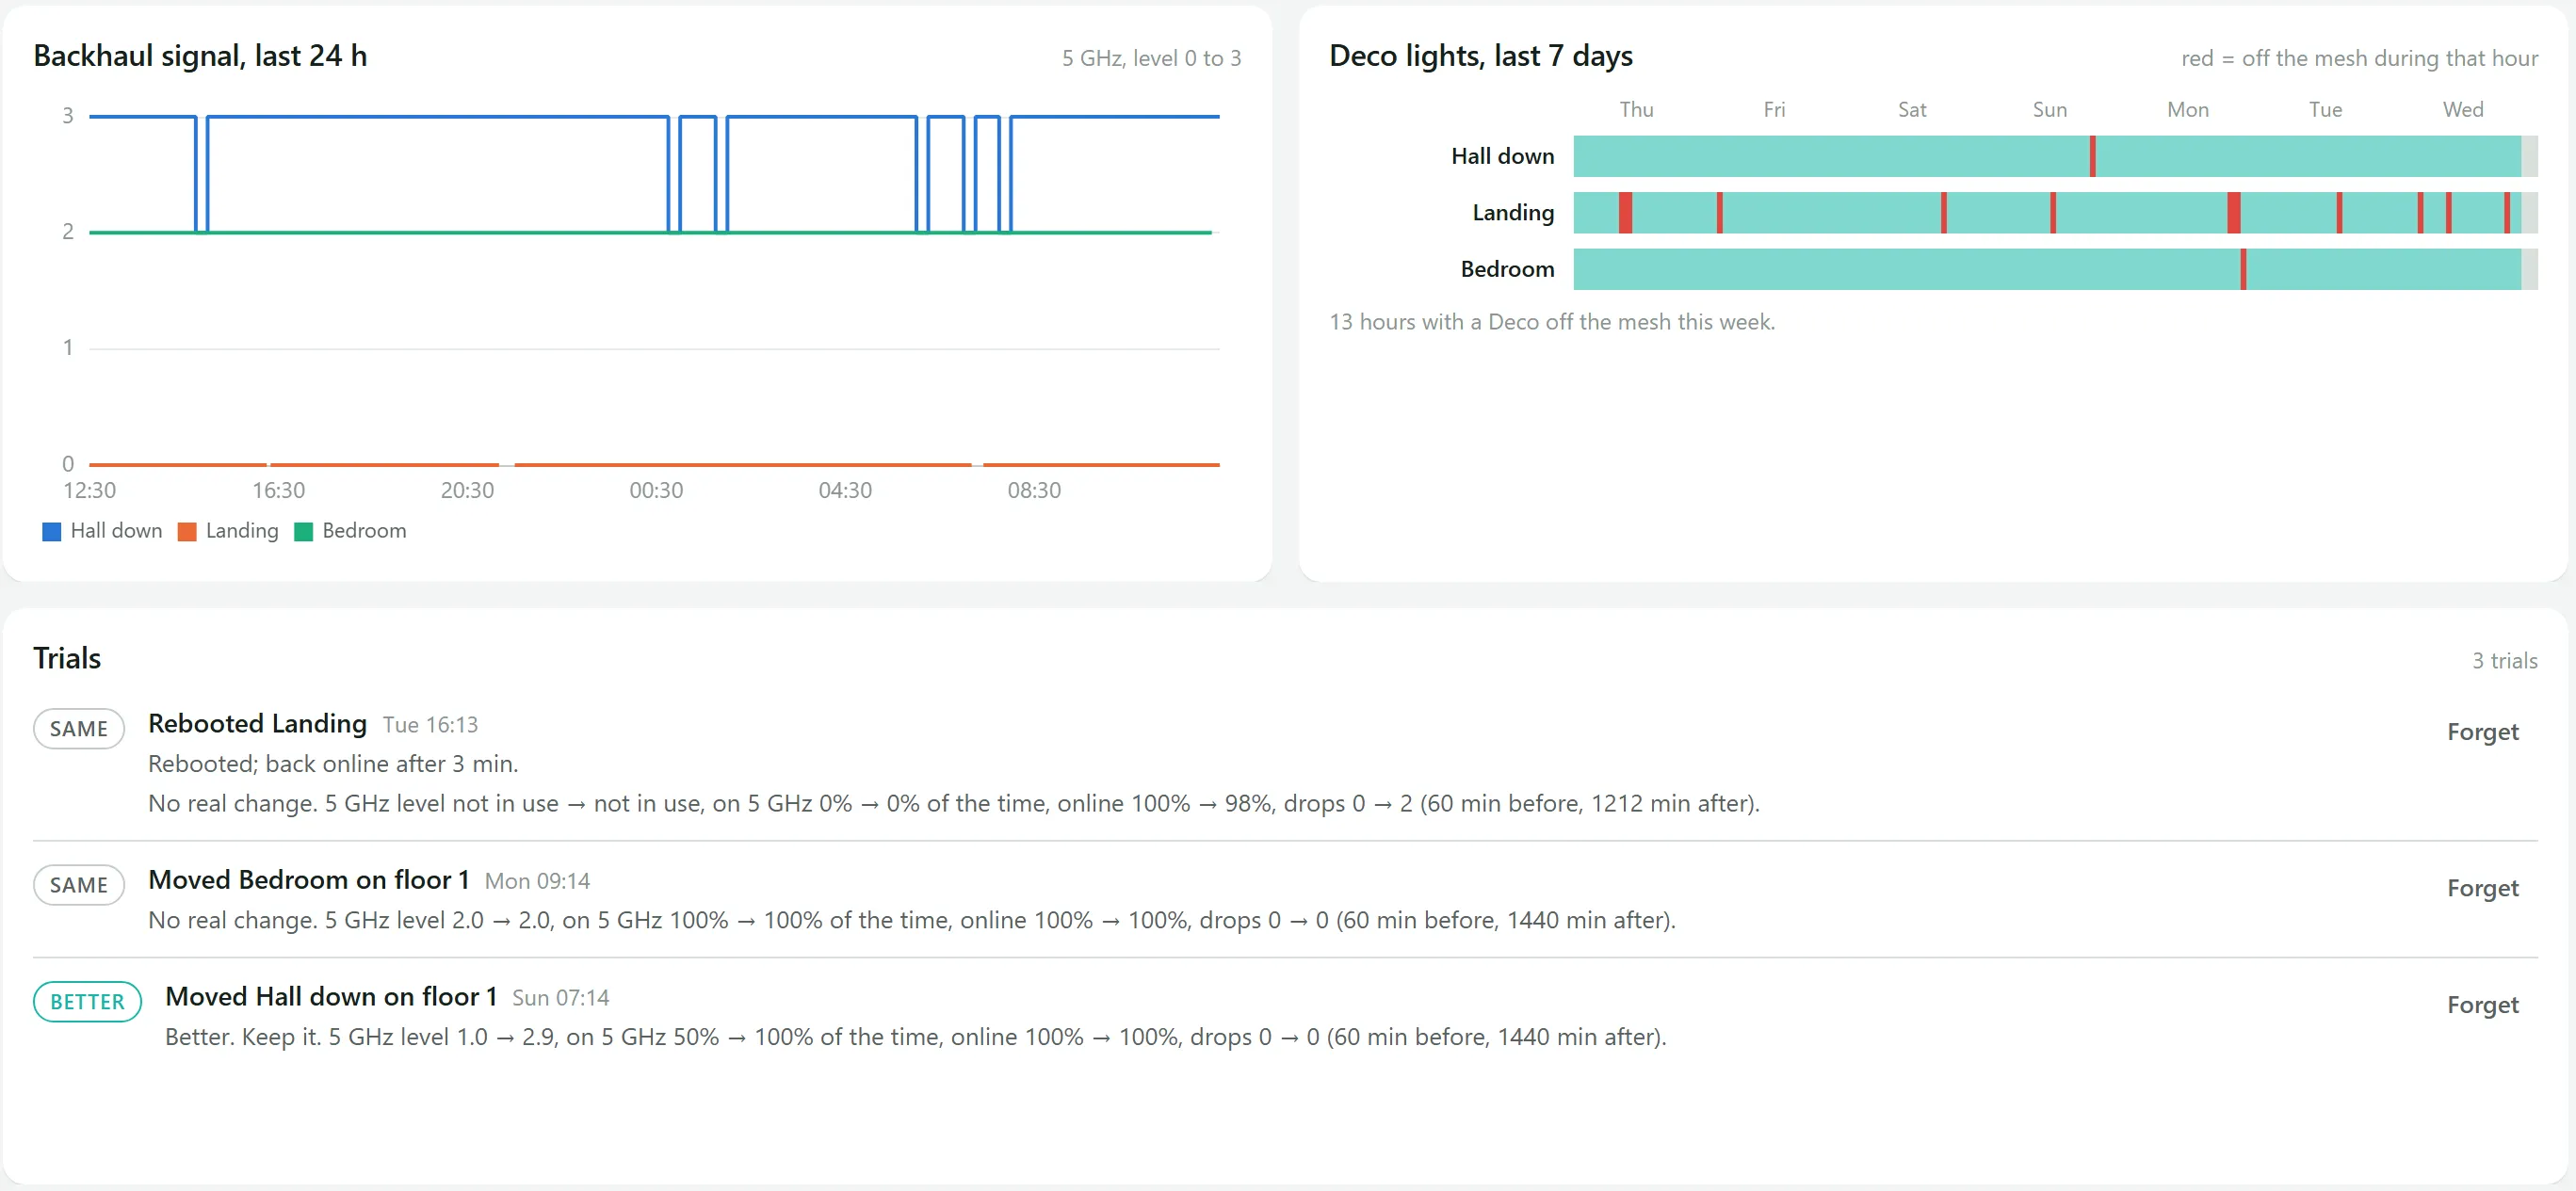
Every change becomes a trial: moving a unit, or restarting one, which is the only thing the app can change, one satellite at a time and always confirmed. The server compares the hour before with the time since, on signal, time on 5 GHz, time online and drops, and writes the verdict as a sentence with the numbers: better, worse, mixed, the same, or too early to tell.
Usage and history
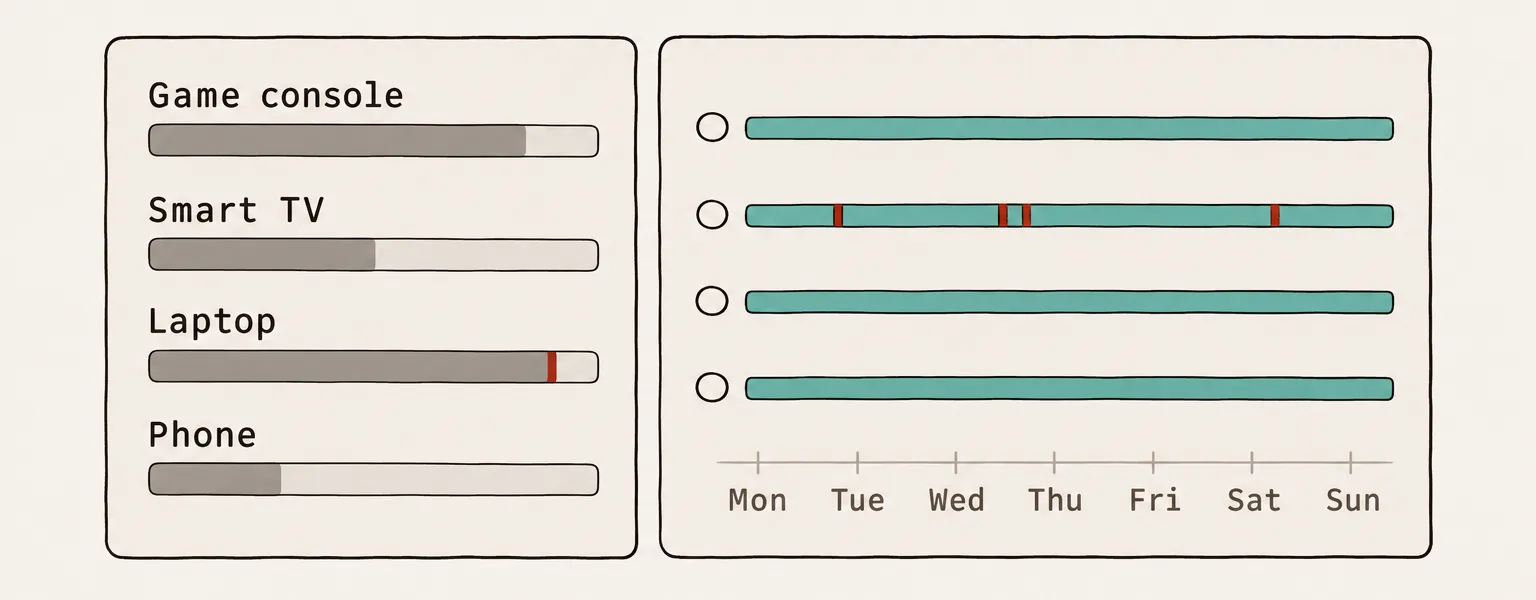
Live speed per device with its band and access point, today's traffic for the busiest devices, each satellite's link over the last 24 hours, and a strip per access point showing its light over the week: how often it goes red, and when.
A layout you arrange
The page is widgets on a grid. In edit mode you drag, resize and hide them, and bring them back from a tray; Save keeps the layout on the server for every browser. On a phone everything stacks in one column.
Honest about its data
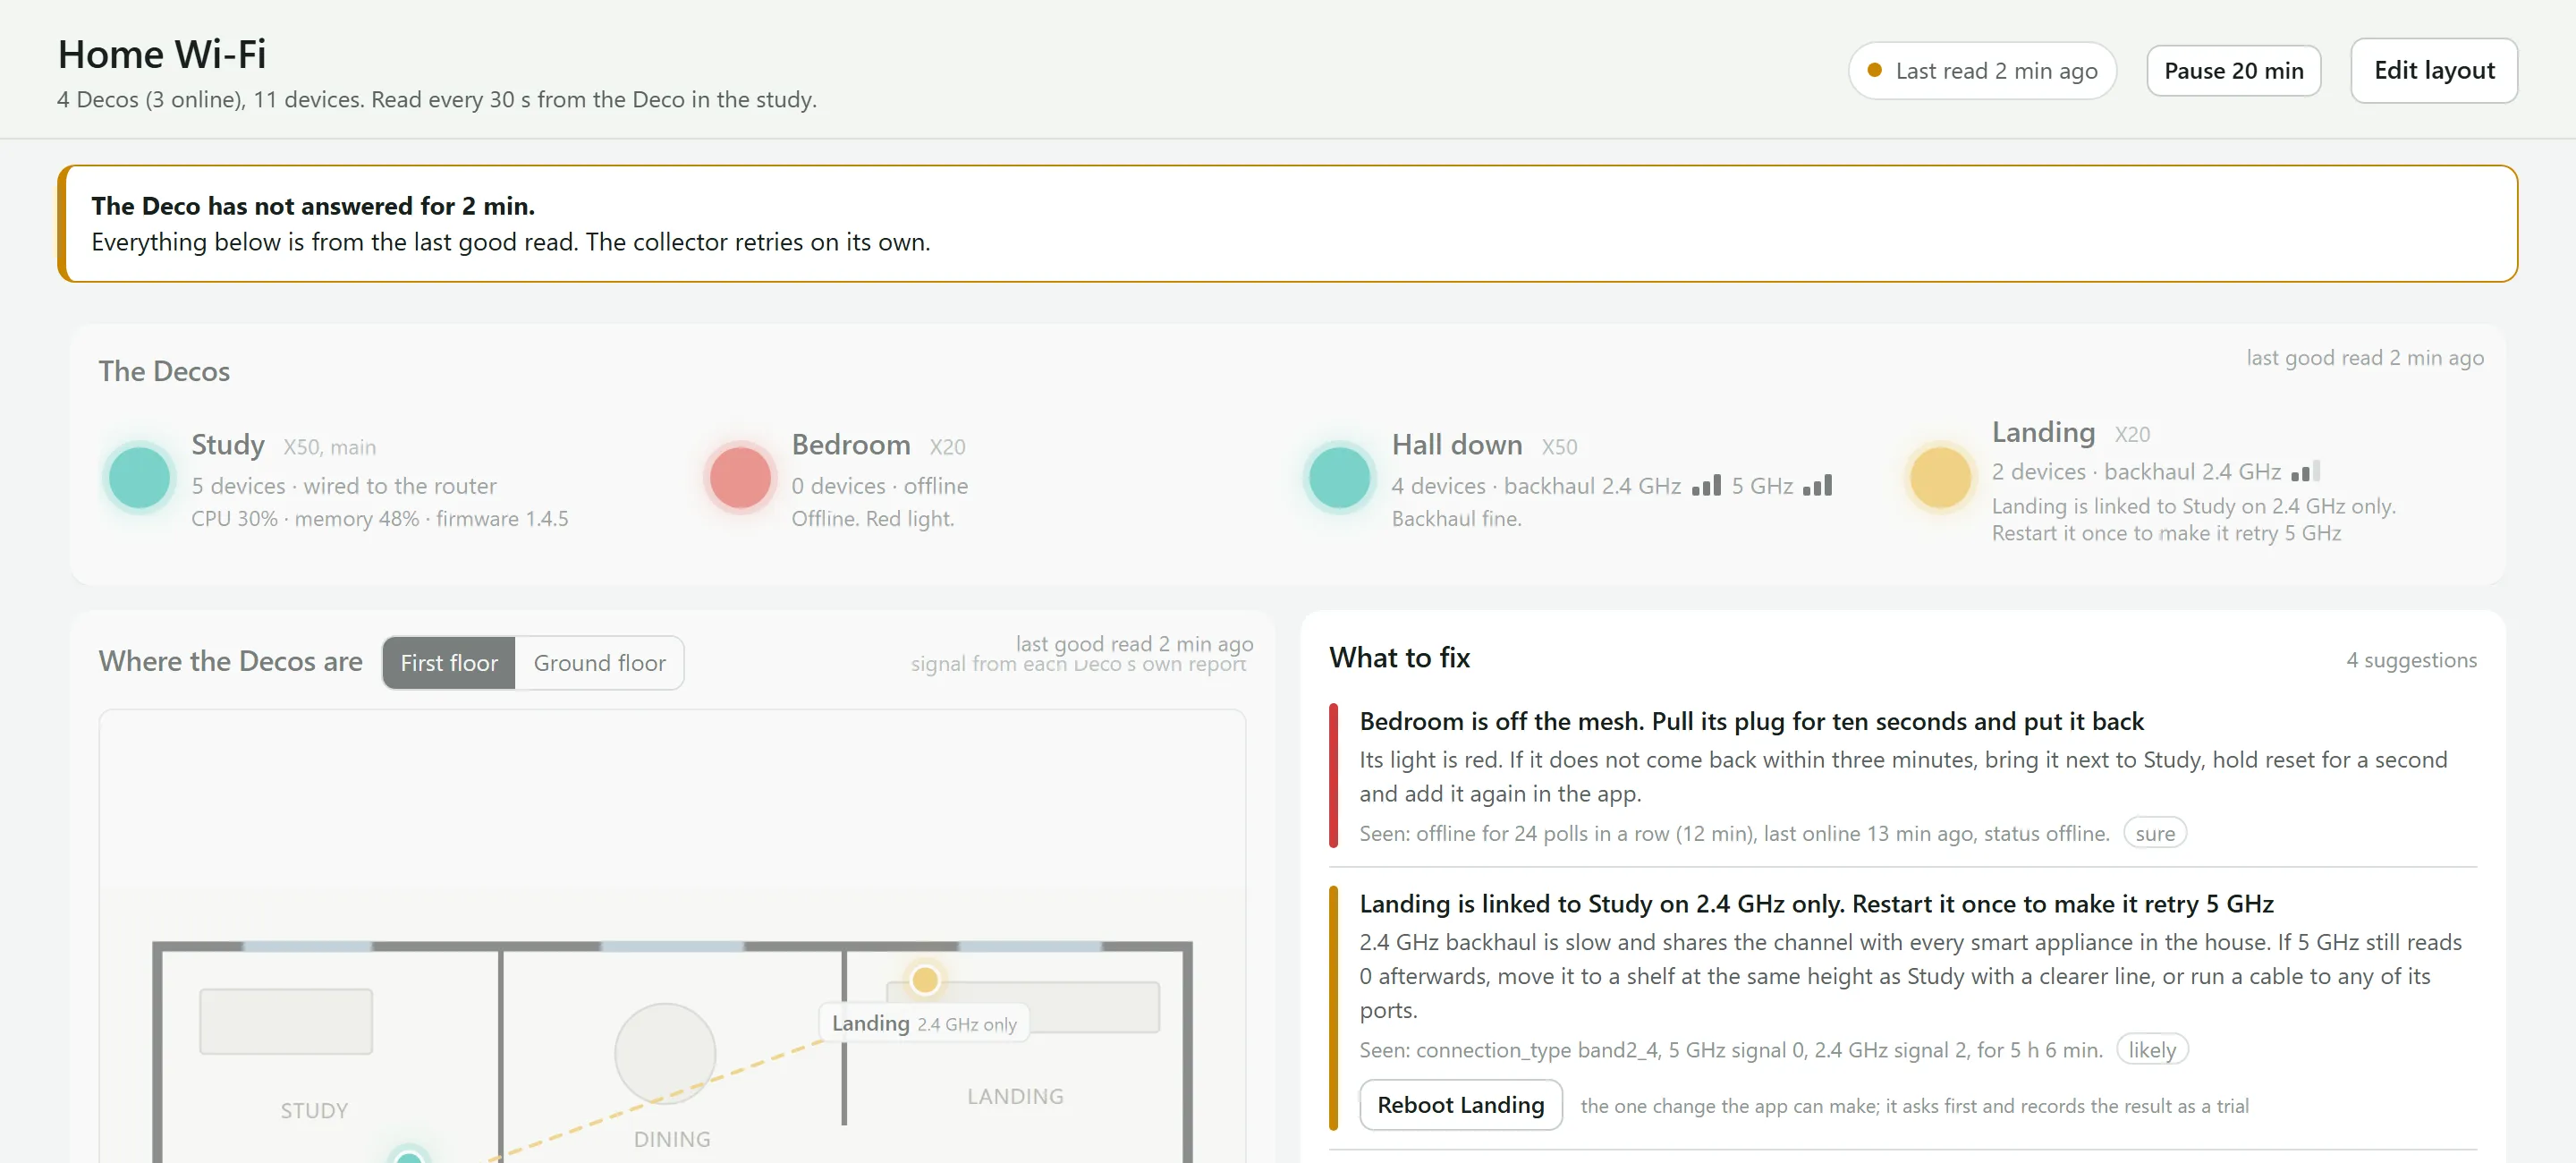
A pill and a banner say whether the data is live, stale, broken, paused or unreachable, and live widgets fade as it ages. Pause stops polling for a while so the vendor's phone app can be used; otherwise the two log each other out.
How it works
- Metadata, not content
- It records which device, on which access point and band, how fast, and when. Never packet contents, domains or browsing, and a recorded decision forbids adding anything that could collect them. The household knows it exists and what it records.
- An undocumented API
- The vendor has no public API. The collector polls the main unit's local web API every 30 seconds, with a protocol ported to Node from an open-source Home Assistant integration: a key exchange, then signed and encrypted requests. It never makes the call that returns the Wi-Fi passwords. Along the way: the speeds are kbit/s, not the KB/s the community labels say; wired clients are not measured at all; and polling faster than every 30 seconds makes the unit drop connections.
- Storage
- The SQLite that comes with Node: 30-second samples kept for 30 days, hourly summaries for a year, and a nightly backup. Failed polls back off, and a wrong password stops the collector so the account does not get locked.
- Safety
- No login of its own: it sits behind the same two-factor sign-in as the other apps. The vendor password lives only in an environment file. A restart is allowed for one satellite at a time, from an allowlist, never the main unit, and is refused while polling is paused or the data is old.
How it is built and tested
- Tests
- About 210 tests, none of them on the real network. The collector is tested against a fake access point that speaks the real encrypted protocol, and about 40 tests cover the rules engine.
- Why build it
- Home Assistant with community cards would have covered most of it, but on a small server it meant unclear memory use, a second login, and about 75 hand-written sensors before per-device history lasted more than ten days.
How Atta helped
- A research brief with nine questions came before any stack was chosen; the agent team was generated only once the stack was settled.
- What it learned about the mesh's local API (speeds come in kbit/s, poll gently) went into the shared wiki for any later project.
- A screen sketch was published as a page to agree the layout before building it.
- Standing rules such as metadata, not content were written as directives every agent follows.